Seeing the invisible.
From dancing black holes to colliding neutron stars, NCSA transforms data that’s hard to imagine into visuals that are impossible to forget.
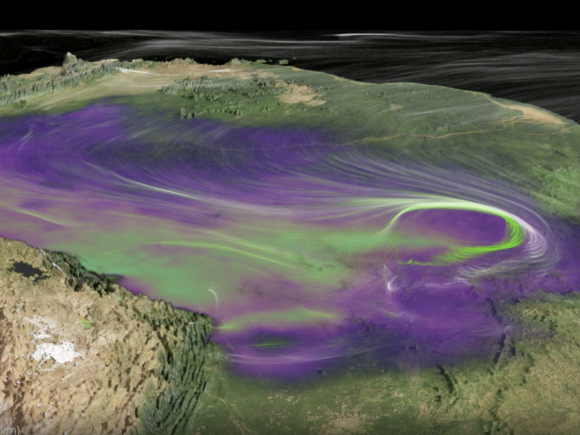
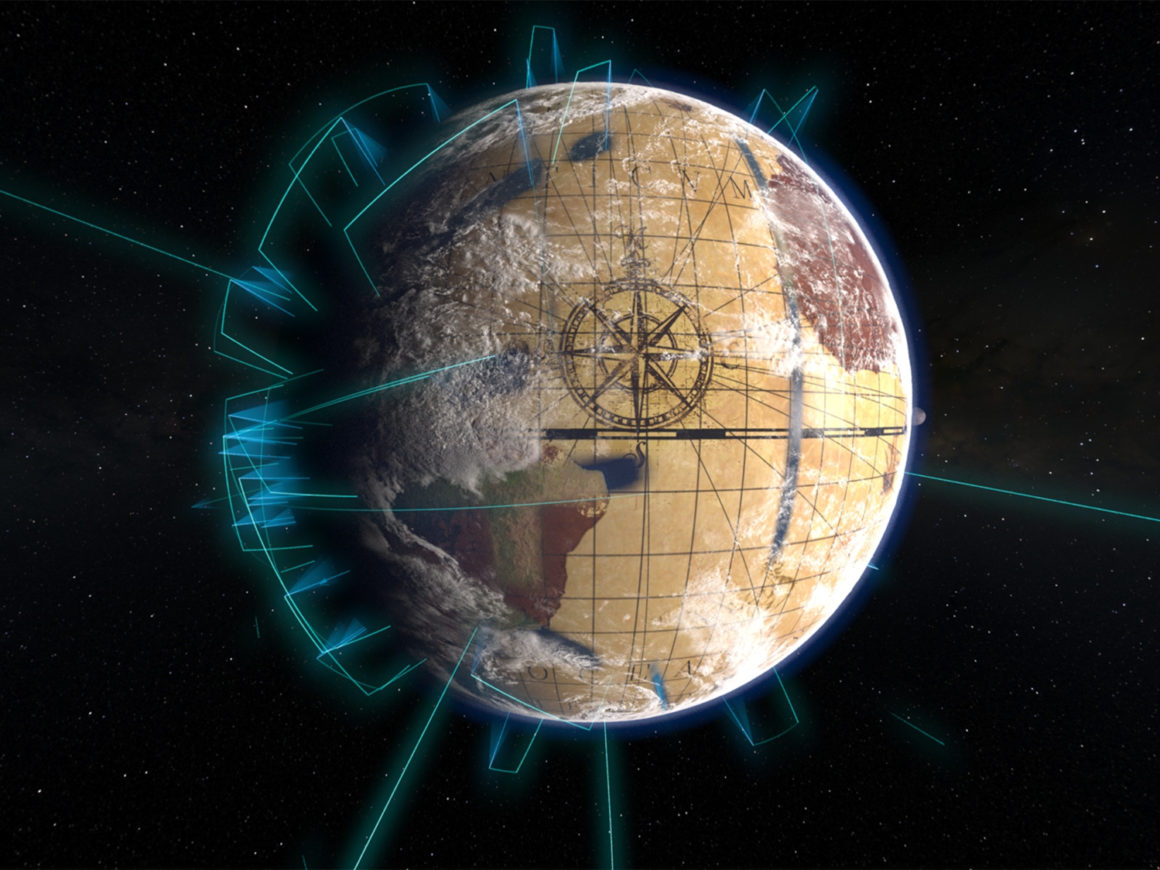
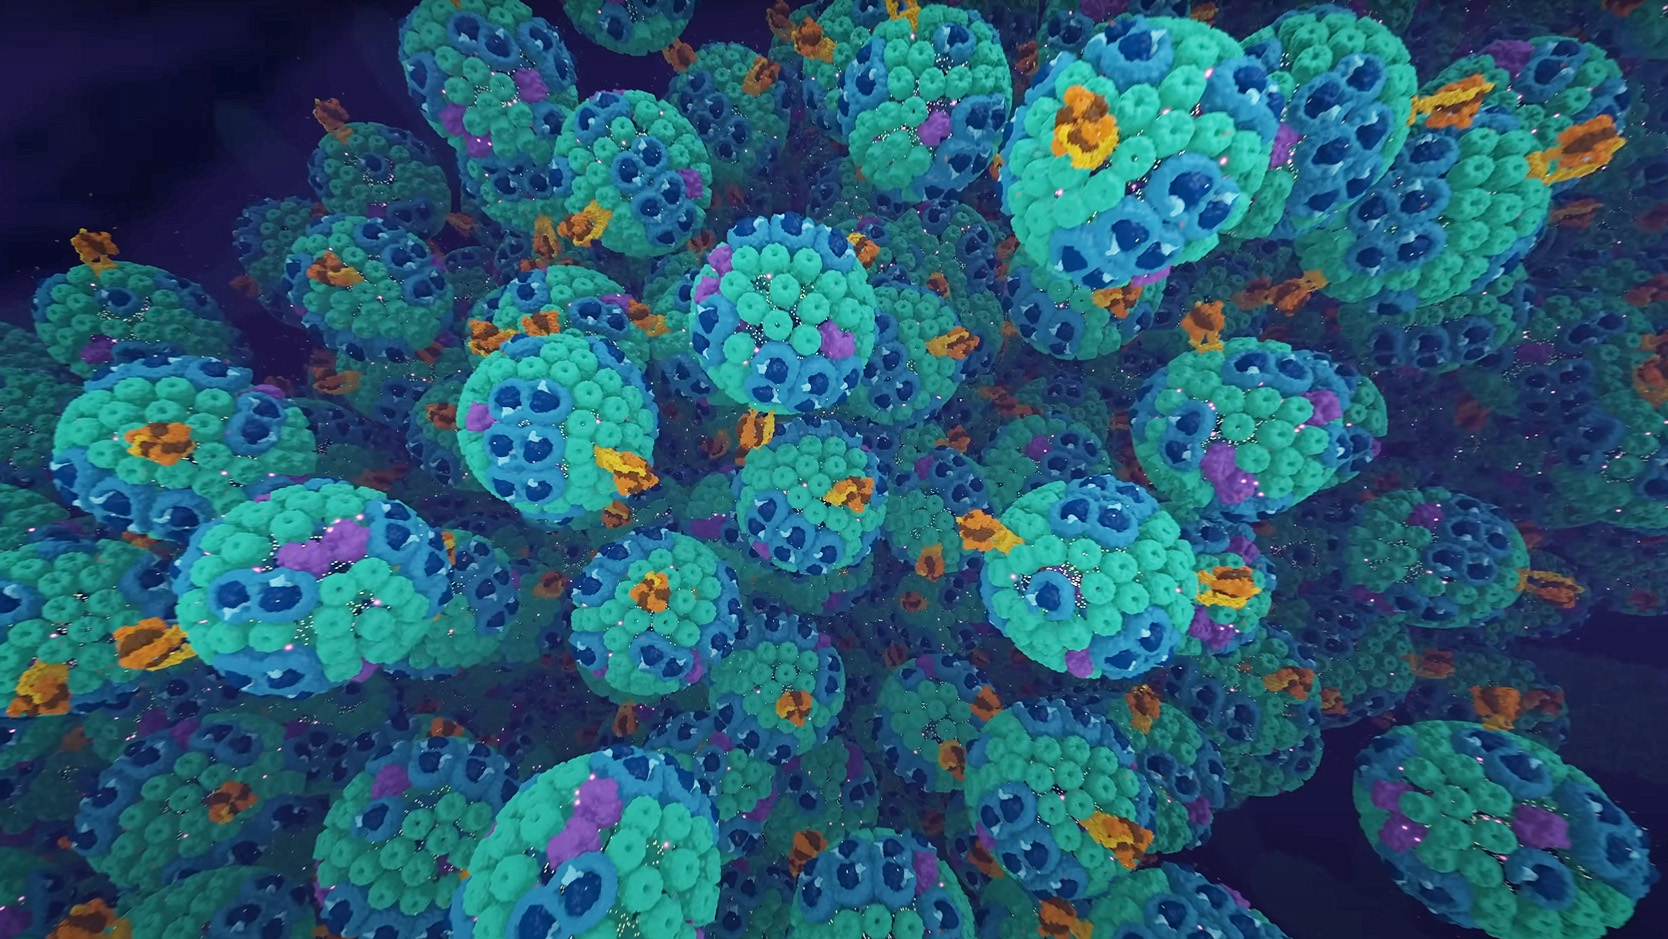
Dating as far back as the cave paintings created in Lascaux, France, imagery, or visualizations, have been used to communicate to one another. At NCSA, visualization closes the gap between what we learn and how, turning raw data into powerful visual displays that resonate with meaning. From the inner workings of the human cell to complex events unfolding at the outer edge of space, visualizations help researchers communicate complex ideas effectively, turning mystery into understanding.
Visualizations from NCSA
Using a breadth of technologies, including custom software, machine learning and much more, NCSA brings science to life across a wide range of domains, from astronomy to earth sciences to genomics. Multi-dimensional representations of data, information, and processes can be displayed in a wide variety of manners at NCSA, including, but not limited to, interactive applications, scientific and cinematic video narratives, planetarium dome shows, and mixed-reality applications. Representative examples of the different types of visualizations at NCSA are shown below.
Questions about NCSA’s visualization services?
Matt Berry
Interim Director, Visualization Program Office
mjberry@illinois.edu

Data Exploration Lab (DXL)
Data Analysis and Visualization

Advanced Visualization Lab (AVL)
Visualization Services at NCSA
Cinematic and scientific visualization video narratives
Production of high-fidelity, high-resolution videos representing data-mapped visualizations to share with the scientific community, funding agencies and as outreach for the general public. Examples include high-quality images, videos, documentaries and dome-show productions.
Interactive visualization applications
Computer programs designed to allow users to interactively control aspects of mapping of data to graphical representations. Example programs include web-based applications, visualization software sessions, or custom-designed 3D programs.
Mixed reality visualization experiences
Applications designed and developed to provide users with an immersive interactive experience with data-mapped visualizations and processes leveraging state of the art technology in virtual reality, augmented reality, or mixed reality.
Consulting
General support for questions regarding visualization software packages, data conversion and graphical representation.
Grants
NCSA visualization provides support for grant-writing activities involved with incorporating aspects of visualization services at NCSA. See Illinois Computes for a way to work with us, at no cost to you.
Visualization Program Office Links
AVL YouTube page
Data Exploration Lab (DXL) website
Visual Analytics Group website
Project Highlights
Atlas of a Changing Earth
With stunning visuals created by AVL, this fascinating documentary explains how a revolution in map making is shedding new light on global warming and its impact on the planet.

Tumor Phylogeny
Find out how visualizing the progression of tumors can help clinicians provide more targeted treatment for patients with cancer.
Reciprocal Space X-ray Diffraction
This project integrated automatic generation of imagery using VisIt into the GridChem Computational Chemistry Grid to simulate diffraction in alumina.

CADENS
CADENS (The Centrality of Advanced Digitally ENabled Science) is a National Science Foundation-supported project to increase digital literacy and inform the general public about computational and data-enabled scientific discovery.
News
Designed for Better Scientific Software
Reaching for the Stars

NCSA Welcomes Pengyin Shan to the Center Stage!

Visualizations Help Make Sense of Supply Chain Processes
Help Desk is available from 7 a.m. to 11:30 p.m., seven days a week, 365 days a year.