Bob Wilhelmson, NCSA’s former Chief Science Officer, had no problem generating simulations that spawn tornadoes. In the late 1980s, however, a wicked thunderstorm that threatened to spawn a tornado was the most computing power at the time would allow. Even that was thrilling, though.
“In the 1970s, I had to travel to the National Center for Atmospheric Research. ARPANET access gave me an early look at the power and importance of networking. Without remote access, supercomputing had to wait until I could travel,” he remembered. By 1989, with the supercomputer centers program and NSFNET up and running, scientists and engineers didn’t have to wait anymore.
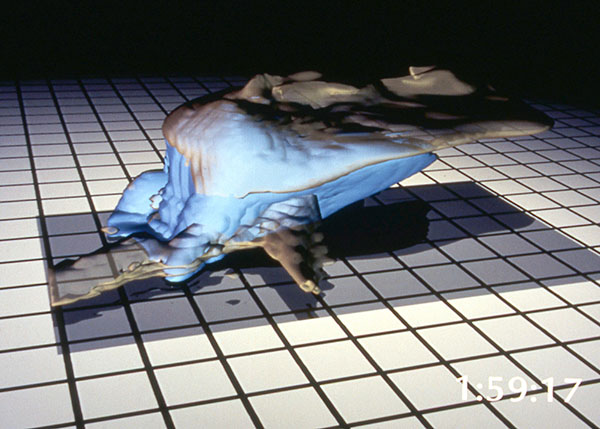
The “number explosion” that supercomputing brought on, the sheer amounts of data it created, meant that ways of interpreting the data had to advance as well. “I would create pictures on paper from the data, and I would literally, using masking tape, place them on a wall to get an idea of how things changed over time. Because at that time, you could only look at a single piece of information. Today, I can create animations on my desktop, rather than running down the hall to see how things change,” Wilhelmson said.
As Donna Cox, who now leads NCSA’s visualization efforts, wrote with collaborator Richard Ellson of Kodak in 1988, advances in computing capacity have “not been accompanied by any perceptible evolution in human physiology to enable the understanding of these massive quantities of data. Reducing this underconsumption requires scientific visualization. [It] transforms numerical data residing on the computer into palatable information for the human mind.”
The visualizations of thunderstorms that the NCSA Visualization Group, then led by Dan Brady, and a team – including Matthew Arrott, Colleen Bushell, Mark Bajuk, Jeffrey Thingvold and Jeffery Yost – built in 1989 were not only palatable, they were beautiful and hugely informative. The animation of a thunderstorm as it forms debuted at SIGGRAPH, the international visualization conference.