Our atmosphere and oceans are steadily warming. Great stores of ice covering Antarctica and Greenland are melting at an increasing rate. To observe and predict the changing face of our planet, three groups of scientists turn to satellites and supercomputers to map these remote regions and track these effects to help guide and inform possible solutions. Their research is exhibited in the telling documentary “Atlas of a Changing Earth,” which prominently features complex datasets processed on Blue Waters and stunning visualizations created by the Advanced Visualization Lab. Both are housed at the National Center for Supercomputing Applications at the University of Illinois Urbana-Champaign. NCSA contributed many scientific and cinematic visualizations, working closely with Spitz Inc. and Thomas Lucas Productions Inc. to produce multiple film formats, including a 24-minute full-dome digital version and a 50-minute 4K flatscreen version.
I’m excited for this film because it’s so timely and important, considering the world’s rapidly changing landscape. I love working on projects that educate people and have the potential to make a difference. There’s nothing more rewarding than solving technical problems to address science communication challenges through beautiful, science-based visualizations that are shown on giant screens around the world. Blue Waters has enabled so many scientific stories to be told. Before we had a title for this film, we actually referred to it as ‘the Blue Waters documentary’ because it was so integral to making this happen. Though, I think ‘Atlas of a Changing Earth’ (ACE) has a better ring to it!
Kalina Borkiewicz, NCSA Principal Research Programmer and AVL Manager
Blue Waters, one of the most powerful supercomputers in the world, processed datasets from three science projects that AVL visualized for the films:
- ArcticDEM and Reference Elevation Model of Antarctica (REMA)
- High-Resolution Community Earth System Model v1.3 Timeslice Model of 2000 and 2100
- Sub-Saharan Africa Tree Survey – only shown in the 4k flatscreen version
“ACE is a remarkable story of how new science is created and then how it is used to understand and explain critical issues. The story started in 2015 when I was approached by Paul Morin of The University of Minnesota’s Polar Geospatial Center to see if Blue Waters could support the new ArcticDEM effort, which was a presidential initiative to create a very high fidelity (2 meter) elevation map of the entire arctic (1/6th of the world) from stereoscopic satellite images provided by the National Geospatial-Intelligence Agency in three years – something never thought possible. Skipping the details, the first full ArcticDEM data release took about 24 months and used billions of core hours and petabytes of data on BW. After that first success, three things happened. One was the need to do Antarctica, which took about one year. The second was the ability to create detailed elevation maps of the entire land surface of the globe, a project underway called EarthDEM. The other was the idea of redoing ArcticDEM multiple times which enables the time-lapse segments of ACE,” explains Research Professor William Kramer, Blue Waters Director and Executive Producer of ACE. “The science teams used over 11 billion core hours to create the elevation data sets from the original satellite images, which now can be seen in time-lapse visualizations to see how the earth’s surface is changing.”
In addition to processing these complex datasets, many of the visualizations included in the films were rendered on Blue Waters, using a total of 6.2 million core hours, to be exact. Without access to the high-performance computing system, creating such high-quality and high-resolution visualizations would have been impossible.
ArcticDEM and REMA
Credit: DEM data created by the Polar Geospatial Center from DigitalGlobe, Inc. imagery, and processed on the Blue Waters supercomputer at NCSA; optical imagery from LANDSAT. Visualization by Advanced Visualization Lab, NCSA, University of Illinois
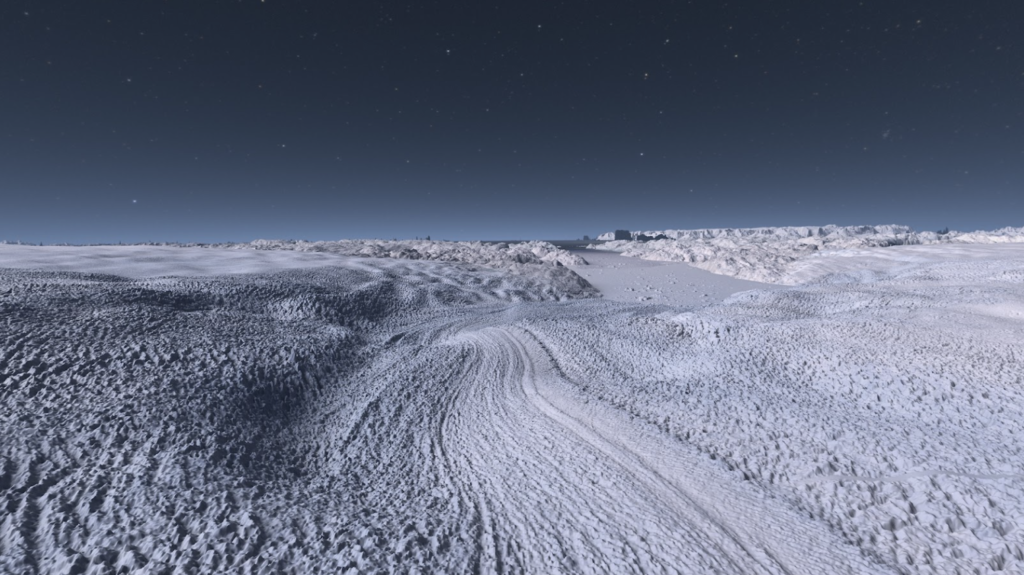
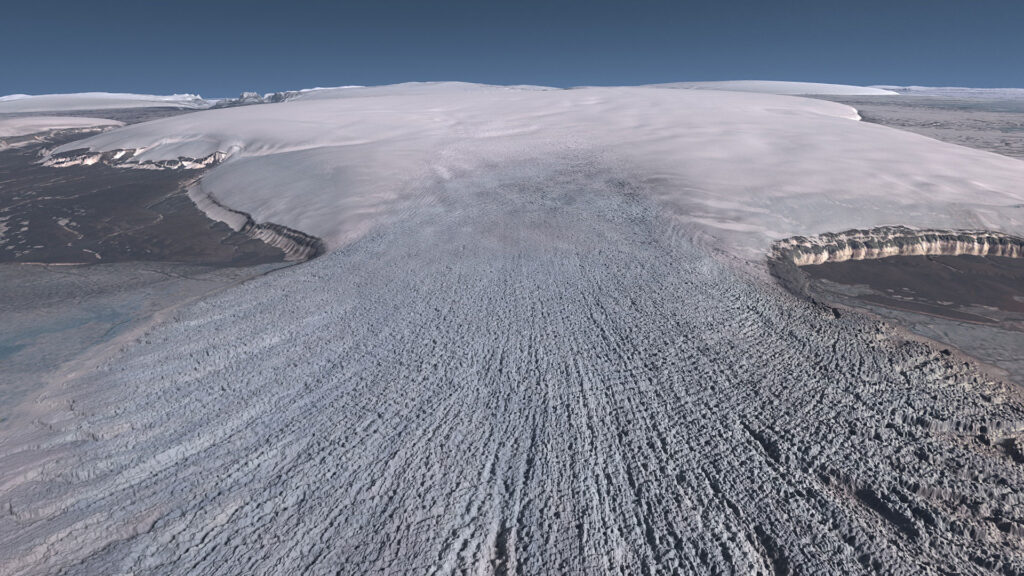
Paul Morin and Ian Howat provided guidance and data from ArcticDEM and REMA that show a full span birds-eye view of the entire Antarctic and arctic regions in three separate shots. One ArcticDEM animation portrays the survey collection method, which repeatedly collects data over several years, measuring progressive changes in the landscape. Others provide views of the ground-level regions of three different glaciers: Vavilov, Jakobshavn, and Pine Island.
“We visualized the buildup of the ArcticDEM survey by showing how thousands of stereoscopic satellite image strips covered the arctic region over the course of years. We then take viewers in for a closeup of the changes happening with the Vavilov Ice-Cap collapse, Greenland’s Jakobshavn glacier flow, and a calving event at the Pine Island Glacier in Antarctica,” says Robert Patterson, Visualization Designer and Artist, AVL vis expert who worked on the film.
“AVL solved numerous challenges to smoothly visualize the temporally dynamic ArcticDEM data for planetarium audiences, including cloud removal, registration, synchronization of DEMs with Landsat color imagery, and matching of seasonal lighting conditions. It was a great team effort to create these data-driven, cinematic visualizations to give viewers an immersive experience of the changes that have happened on our planet and the modeled projections of the future.”
High-Resolution Community Earth System Model v1.3
Credit: High-Resolution Community Earth System Model (CESM) v1.3 Timeslice Simulation of Years 2000 and 2100 by Susan C. Bates, Nan A. Rosenbloom, et al., National Center for Atmospheric Research (NCAR). Visualization by Advanced Visualization Lab, NCSA, University of Illinois. NCAR is supported by the NSF.
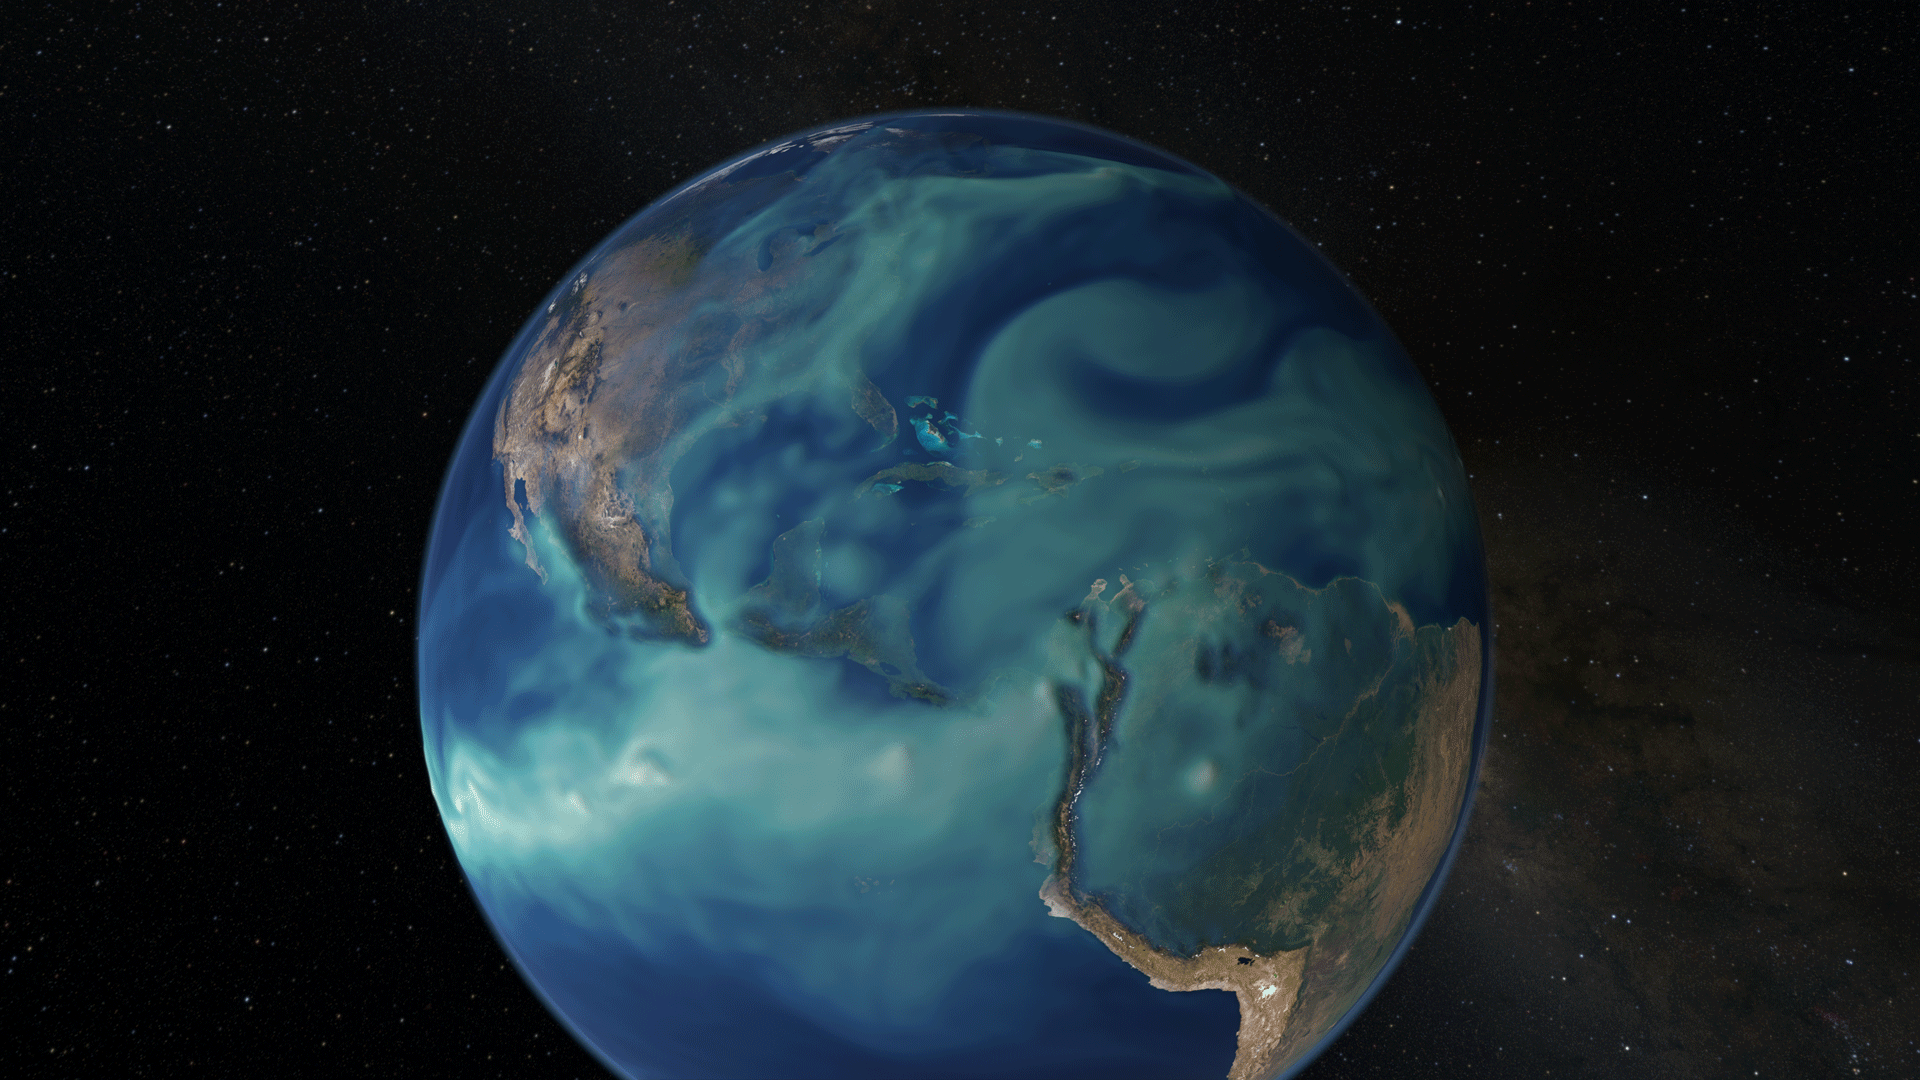
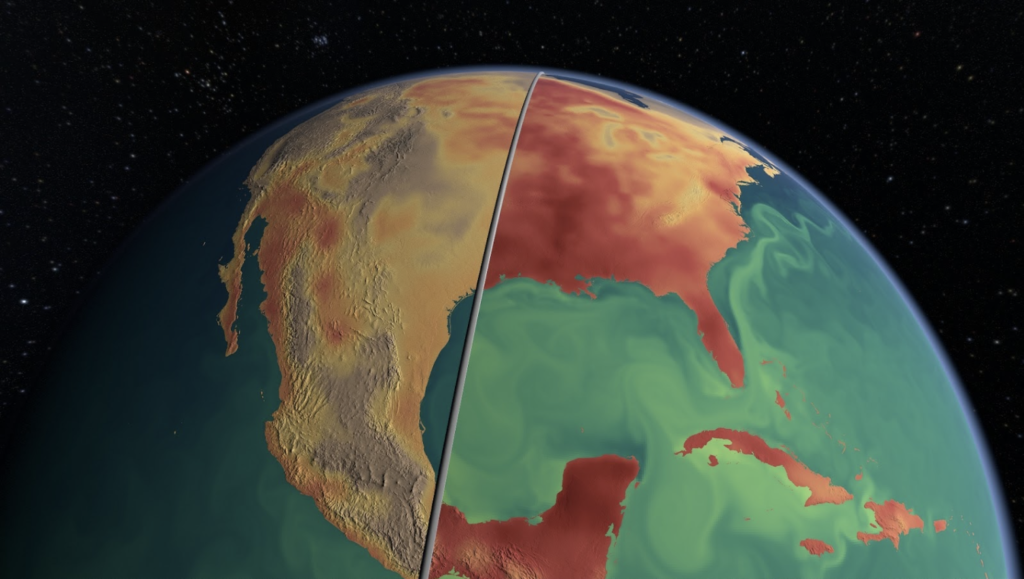
Susan Bates and Nan Rosenbloom provided guidance and CESM® datasets that focus on climate simulations showing the differences between Earth’s surface in 2000 and 2100 based on a “business as usual” emissions scenario. The three visualizations show stark changes in daily average surface temperature, arctic sea ice cover, and moisture in the atmosphere between the two centuries.
“Working with the film crew and technical staff has been very rewarding and a lot of fun. They were able to translate our science into visualizations in ways that we could never have imagined. One technique that I found effective and innovative is a video in which a line swipes across the globe with present-day climate conditions on one side and future conditions on the other. Seeing climate change in this side by side comparison is startling,” says Bates, Project Scientist in the Climate and Global Dynamics Division (CGD) at the National Center for Atmospheric Research (NCAR) and Coastal Science Program Manager at The Nature Conservancy in Virginia.
“Something that I am passionate about in my work is making the science that I do relevant and interesting to the public. Specifically, I look for ways to address societally relevant concerns by applying what we learn from global climate models, like the Community Earth System Model. I have so much satisfaction from this project because that is exactly what it has done.”
Bates’ colleague and fellow CGD NCAR researcher Nan Rosenbloom adds, “We all know that climate change represents a major threat to society, and we are already experiencing the real-world impacts of extreme weather events. For me, one of the most viscerally striking moments in the animation is seeing the changes in arctic sea ice projected on the globe. Somehow that image, together with the sea-level rise animations, really illustrates how dramatically we are changing our future.”
“We were excited to be able to contribute to this important show. We could not have conducted these climate model simulations without access to supercomputers like Blue Waters, especially for the high-resolution simulations used for this animation. Our allocation on Blue Waters was a primary catalyst for the entire suite of high-resolution climate simulations that came after these initial experiments.”
Sub-Saharan Africa Tree Survey Data
Credit: Katharine Melocik, Lori Perkins, Greg Shirah, Compton Tucker and others, NASA Goddard Space Flight Center; DigitalGlobe satellite imagery used for tree survey processing. Visualization by Advanced Visualization Lab, NCSA, University of Illinois
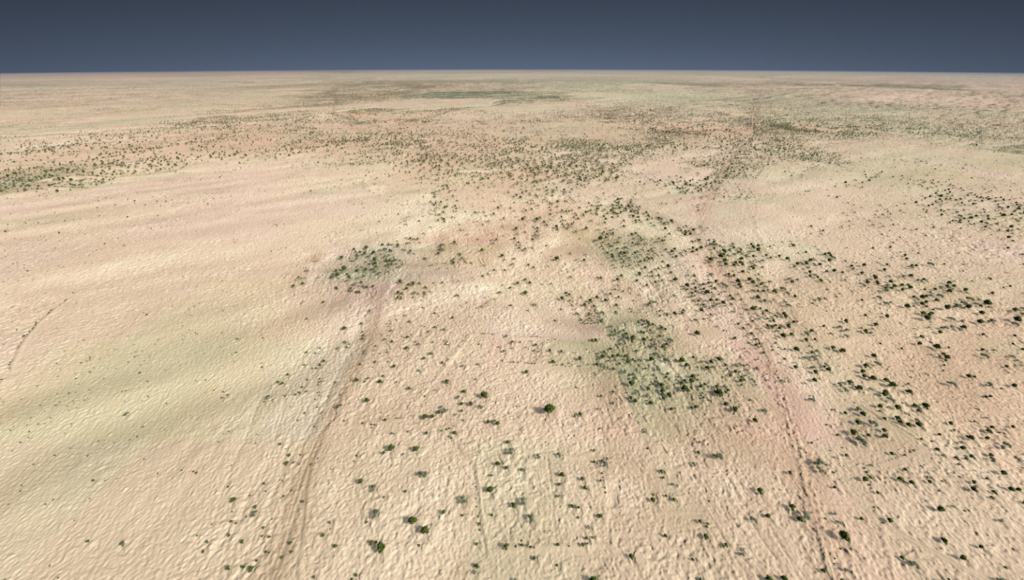
Compton J. Tucker and Katie Melocik provided guidance and datasets from this project, which used satellite imagery and Blue Waters’ processing power to map trees and bushes in sub-Saharan Africa. The research revealed many small trees than previously recognized, a crucial insight for understanding Earth’s carbon cycle. Two visualizations are shown in the flatscreen version of the documentary – one photorealistic and one diagrammatic, combined into a single shot – featuring satellite data of around 760 million trees across Senegal.
As stated in the team’s abstract in their published work by Brandt et al. in Nature, “A large proportion of dryland trees and shrubs grow in isolation, without canopy closure. These non-forest trees have a crucial role in biodiversity and provide ecosystem services such as carbon storage, food resources, and shelter for humans and animals. However, most public interest relating to trees is devoted to forests…Our assessment suggests a way to monitor trees outside of forests globally and to explore their role in mitigating degradation, climate change, and poverty.”
Atlas of a Changing Earth: A Reality That Hits Home
Credit: DEM data created by the Polar Geospatial Center from DigitalGlobe, Inc. imagery, processed by the Blue Waters supercomputer at NCSA; optical imagery from LANDSAT. Visualization by Advanced Visualization Lab, NCSA, University of Illinois.
“I am thrilled to have helped create this important documentary showing how supercomputing and satellites are revolutionizing the digital mapping of the earth,” says Donna Cox, Illinois Professor Emerita, Director AVL Emerita, and Michael Aiken Chair Emerita. “This story increases public understanding about our next global crisis after COVID: Climate Change.”
Earth’s climate has changed throughout history, including seven glacial advance and retreat cycles over the last 650,000 years. The last ice age ended nearly 12,000 years ago, marking the beginning of the modern climate era and human civilization. While natural cycles, like the ones mentioned previously, have driven climate change for millions of years, the rate of change that we observe and experience today is unprecedented. These drastic changes are a consequence of human activities primarily involving burning fossil fuels and land clearing. Due to such, the concentration of greenhouse gases has increased, preventing heat from leaving Earth and contributing directly to the melting of polar ice caps.
“Science can be complex, and people rely on the theaters and institutions that show this content to help them understand it,” says Brad Thompson, Animation/CG Director, Spitz Creative Media. “I feel a great responsibility to these institutions and the people that trust them to ensure that what we present is truthful, without being sensationalized, but also interesting and inspiring. I’m trained as an artist, so every show requires me to take a deep dive into the science first, and I learn something new each time. This time, working on the flood simulator, it was how much water is tied up in ice sheets and glaciers, and how little sea rise it takes to devastate coastal cities.”
This documentary was shown at Dome Fest West in Costa Mesa, California, on October 8 and won DFW’s “Best Environmental Film” award.
Film Credits
University of Illinois Contributors: Donna Cox, Bob Patterson, Stuart Levy, Jeff Carpenter, AJ Christensen, Kalina Borkiewicz, William Kramer, Kjellrun Olson
Blue Waters Scientific Data and Advisors: Paul Morin, Polar Geospatial Center, University of Minnesota; Ian Howat, Byrd Polar, and Climate Research Center, The Ohio State University; Susan C. Bates, National Center for Atmospheric Research (NCAR), The Nature Conservancy; Nan A. Rosenbloom, (NCAR); Compton J. Tucker (NASA), Katherine Melocik (NASA); Don Wuebbles (UIUC).
Simulation and Visualization Computed on the Blue Waters Sustained Petascale Computing Project. Blue Waters is a joint effort of the University Of Illinois at Urbana-champaign and its National Center for Supercomputing Applications.
Supported by the National Science Foundation (Awards OCI-0725070 And ACI-1238993), the State Of Illinois, and the National Geospatial-intelligence Agency.
Produced by: Advanced Visualization Lab, National Center for Supercomputing Applications, Cosm Studios in Association with Spitz, Inc., and Thomas Lucas Productions, Inc.
Director: Thomas Lucas
Narrator: January Lavoy
ABOUT AVL
The Advanced Visualization Lab is a “Renaissance Team,” where each member of the AVL team plays a unique role and contributes a variety of skills to the process, development, and production at NCSA. Their expertise includes advanced graphics and visualization techniques, artistic design, cinematic choreography, multimedia and video production, and data management and render wrangling. AVL bridges the gap between science and the arts by creating high-resolution data-driven cinematic-quality visualizations for public outreach.
ABOUT BLUE WATERS
The Blue Waters sustained-petascale system is one of the most powerful supercomputers in the world. Located at the University of Illinois Urbana-Champaign, it can complete more than one quadrillion calculations per second on a sustained basis and more than 13 times that at peak speed. Blue Waters is a joint effort of U of I and its National Center for Supercomputing Applications. NCSA manages the Blue Waters project and provides expertise to help scientists and engineers take full advantage of the system for their research. Blue Waters is supported by the National Science Foundation through awards OCI-0725070 and ACI-1238993, the State of Illinois, and the National Geospatial Intelligence Agency.
ABOUT NGA
NGA delivers world-class geospatial intelligence that provides a decisive advantage to policymakers, warfighters, intelligence professionals and first responders. NGA is a unique combination of intelligence agency and combat support agency. It is the world leader in timely, relevant, accurate and actionable geospatial intelligence. NGA enables the U.S. intelligence community and the Department of Defense to fulfill the president’s national security priorities to protect the nation. For more information about NGA, visit us online at www.nga.mil, on Instagram, LinkedIn, Facebook and Twitter.
ABOUT NCSA
The National Center for Supercomputing Applications at the University of Illinois Urbana-Champaign provides supercomputing and advanced digital resources for the nation’s science enterprise. At NCSA, University of Illinois faculty, staff, students, and collaborators from around the globe use these resources to address research challenges for the benefit of science and society. NCSA has been advancing many of the world’s industry giants for over 35 years by bringing industry, researchers, and students together to solve grand challenges at rapid speed and scale.